Most paid media advice focuses on optimizing individual metrics like CTR, CPA or conversion rate. The problem with this is the metrics don’t exist in isolation. Performance results from the system of interconnected components including offer, creatives, audience, bidding, attribution, landing page, first-party data and external market forces.
When performance drops, the challenge isn’t fixing the metric, it’s taking a deep dive into the system to determine what caused the drop.
This article provides a framework for systematically diagnosing campaign performance issues.
The Offer Is the Foundation
The most important part of your paid media strategy is ensuring that you create quality ad creatives and that the ad offer matches the landing page. If there is not a seamless experience from when the user clicks the ad to what they see on the landing page, you begin to lose trust, and performance will suffer. No amount of optimization will fix it.
Most paid media optimization advice focuses on individual tactics (CTR, CPA, audience targeting, creative testing). Those do matter but they are pieces of a larger overall strategy. Taking a step back and viewing the system holistically can help you understand and optimize each step. No amount of account configuration can fix a bad offer.
- A sophisticated bidding strategy cannot fix a bad landing page.
- A correctly targeted audience cannot fix a poor creative
- A fast landing page cannot fix a bad offer.
The offer is the foundation on which the rest of the system rests.
The Paid Media Diagram
The system is complex. We’ve built an interactive map that shows all of the steps in the system and how they relate to each other.
Understanding how the pieces connect is important in optimizing the system.
Explore the interactive paid media system diagram →
How to Diagnose Campaign Performance Problems
When performance changes, the instinct is usually to react directly to the metric.
ROAS drops? Cut budget.
CPA rises? Lower bids.
Conversion rate falls? Rewrite ad copy.
The problem is that these metrics are outputs of the system, not inputs.
A CPA spike could be caused by a broken conversion tag, a slower landing page, increased competition, audience deterioration, attribution changes, or creative fatigue. Without understanding the connections between layers, you end up treating symptoms instead of causes.
Example: ROAS Drops 30%
Rather than immediately reducing spend, investigate the system:
- Verify conversion tracking
- Has a conversion action changed?
- Was a tag removed or modified?
- Have attribution settings changed?
- Review landing page performance
- Has page speed declined?
- Has a checkout issue appeared?
- Did a recent deployment introduce errors?
- Examine auction conditions
- Have competitors increased spend?
- Have CPCs increased?
- Has impression share declined?
- Review audience quality
- Have Customer Match audiences expired?
- Has remarketing volume decreased?
- Has audience expansion widened targeting?
- Check creative performance
- Has CTR declined?
- Are users seeing the same ads too frequently?
- Has creative fatigue set in?
- Review attribution changes
- Has attribution methodology changed?
- Have conversion windows changed?
- Evaluate external factors
- Has demand shifted?
- Is seasonality affecting performance?
- Have inventory levels changed?
Only after identifying the root cause should campaign settings be adjusted.
The Campaign Inputs You Control
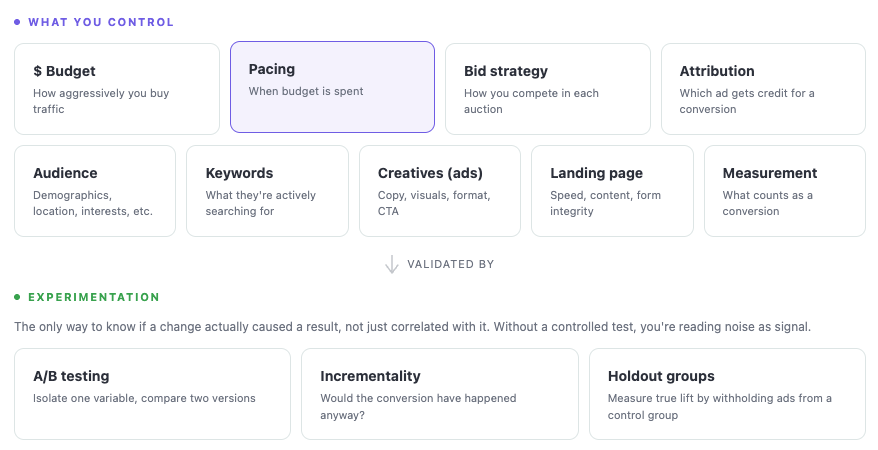
Here are the inputs that you control for the campaign. The best way to validate the effects of changing input values is to run an experiment (discussed in the next section).
-
$ Budget: How much you spend
-
Pacing: When you spend. Some options are
- Even: A consistently daily target
- Front-loaded: Spend more at the beginning of the month
- Back-loaded: Spend more at the end of the month
- Day-parting: Adjusted for day or hour
- Active pacing: Algorithm sets budgets dynamically.
-
Bid Strategy: Manual CPC, Target CPA, Target ROAS, Max conversions
-
Attribution: Determining which ad gets credit for a conversion
- First-click: Credit goes to the first ad the user clicked. Favors awareness and prospecting campaigns that initiate the journey.
- Last-click: Credit goes to the final ad clicked before converting. The default in most platforms. Over-credits retargeting and brand keywords.
- Linear: Credit split evenly across every touchpoint in the path. More balanced but treats every interaction as equally important.
- Data-driven: Machine learning distributes credit based on which touchpoints actually influenced conversion. Requires sufficient conversion volume to train the model.
Attribution is hard. The type of business you run helps to determine which type of attribution you should use. There is no right answer though. You’re just trying to approximate as closely as possible.
One of the biggest issues is that the ad platforms are incentivized to over-inflate revenue attributed to them. If they touched a customers, they will attribute the sale to themselves. Third-party tools can be helpful in creating better approximations of who the revenue should be attributed to.
First-Party Data Powers Modern Advertising
First-party data is data that only you have access to. By sharing that data with Google Ads, you can improve targeting, bidding, measurement and audience creation. Here are some examples
- Transactions: Pass order value and purchase history back to Google via a conversion tag. Google uses this to shift from optimising for an individual conversion value towards total customer LTV. Bidding more aggressively for users who are likely to spend more over their lifetime rather than just converting once.
- GA4: Page visits, events, time on site, cart abandons, and form responses feed remarketing lists and inform customer value signals.
- Offline events: Data from in-person purchases, phone call outcomes, etc gives Google a more complete picture of the customer journey
- External signals: Weather, inventory levels, foot traffic, stock prices, etc can all affect sales.
All of this data can be provided to Google to enhance performance through
- Customer Match: Upload emails, phone numbers or addresse, and Google matches them to signed-in users. Use this to target known customers directly, exclude them from campaigns or use them as a seed for lookalike audiences.
- Remarketing Audiences: Use GA4 data to build audiences based on previous interactions like product viewers, cart abandoners or lapsed users (haven’t logged in for 30+ days).
- Lookalike Audiences: You upload your highest value customers and Google identifies common characteristics to find new users who match that profile.
- Dynamic Spend Rules: Use external signals like weather, inventory levels, day of week, and promotions to trigger automatic spend adjustments. Rather than manually shifting budgets, you define rules that tell Google when conditions change. E.g. Boost spend when conditions predict higher conversion rates, like warm weather for seasonal products. Reduce spend when a product has low inventory.
The External Factors You Can’t Control
Like anything in life, there are many factors you can’t control. Having an understanding of these external factors and adjusting strategy accordingly can improve performance.
- Competition: More advertisers in the auction drives up CPC.
- Demand Shifts: Changes in search volume or buyer intent affect how much impression opportunities exist.
- Seasonality: Predictable performance swings (e.g. black friday). Understanding these occur and adjusting strategy can have a dramatic impact on performance.
Why Experimentation Matters
Experiments are the best way to determine the effects of modifications to the inputs and help to determine if the spend is incremental (i.e. dollar spent actually caused the sales). Without a controlled experiment, you are just guessing.
Attribution estimates contribution. Experiments measure causation.
A good example of spend that may not be incremental is brand spend, because those dollars are more likely to have converted anyway, since the customer already demonstrated intent. The two types of experiments are:
- A/B Testing: Change one thing, a headline, a landing page, a bid strategy, and split traffic evenly between the two. The difference in outcome is causally attributable to that change. Most platforms have native experiment tools; use them instead of making changes mid-flight and comparing before/after.
- Holdout Groups: Suppress ads from a randomly selected control group while running normally for everyone else. The gap in conversion rate between exposed and holdout is the true lift your campaigns are generating. Groups could be based on Geo region (e.g. show in Iowa but not in Nebraska) or audience holdout (randomly select users to show to vs. not)
Paid media performance is not determined by a single metric. It emerges from the interaction of offer, creative, audiences, bidding, attribution, landing pages, first-party data, and external market forces.
When performance changes, resist the urge to optimize the nearest metric. Trace the system, identify the root cause, and then make adjustments.